01 Aug , 2025 By : Debdeep Gupta

The Nifty 50 closed the F&O expiry session with an 87-point loss on July 31, following the announcement of a 25 percent tariff by the US on India. Technical indicators signaled sideways action in the frontline indices amid the prevailing bearish sentiment. As long as the index trades below the 20-day and 50-day EMAs, consolidation may continue, with 24,600 (which coincides with the 100-day EMA) acting as strong support. On the higher side, 25,000 is seen as a crucial resistance zone—only a decisive move above it may turn the trend favourable for the bulls, according to experts.
Here are 15 data points we have collated to help you spot profitable trades:
1) Key Levels For The Nifty 50 (24,768)
Resistance based on pivot points: 24,909, 24,985, and 25,108
Support based on pivot points: 24,664, 24,588, and 24,465
Special Formation: The Nifty 50 formed a bullish candle with a long upper shadow on the daily timeframe, indicating selling pressure at higher levels despite a sharp recovery from the day's low. The index remained below both the short-term (20-day EMA) and medium-term (50-day EMA) moving averages, which are critical for any sustained upside. Momentum indicators offered mixed signals. The RSI at 40.91 maintained a bearish crossover and reflected sideways action, the MACD remained below the zero line, although histogram weakness waned slightly. The Stochastic RSI showed a bullish crossover. Altogether, these suggest continued consolidation.
2) Key Levels For The Bank Nifty (55,962)
Resistance based on pivot points: 56,300, 56,503, and 56,831
Support based on pivot points: 55,644, 55,441, and 55,113
Resistance based on Fibonacci retracement: 56,342, 56,590
Support based on Fibonacci retracement: 55,683, 55,150
Special Formation: The Bank Nifty formed a bullish candle with a long upper shadow and a minor lower shadow on the daily timeframe, reflecting selling pressure at higher levels amid intraday volatility. The index failed to defend its 50-day EMA, signaling ongoing bearish sentiment. The RSI at 42.02 continued to trend lower. The MACD remained below the zero line, with the histogram showing further weakness. This combination of indicators points to sustained pressure on the index unless key resistance levels are reclaimed.
3) Bank Nifty Put Options Data
According to the weekly options data, the 25,000 strike holds the maximum Call open interest (with 49.79 lakh contracts). This level can act as a key resistance for the Nifty in the short term. It was followed by the 25,200 strike (37.7 lakh contracts), and the 25,500 strike (36.59 lakh contracts).
Maximum Call writing was observed at the 25,000 strike, which saw an addition of 20.85 lakh contracts, followed by the 25,500 and 24,800 strikes, which added 18.5 lakh and 13.33 lakh contracts, respectively. There was hardly any Call unwinding seen in the 24,000-25,550 strike band.
4) Nifty Put Options Data
On the Put side, the maximum Put open interest was observed at the 24,000 strike (with 46.01 lakh contracts), which can act as a key support level for the Nifty. It was followed by the 24,500 strike (36.7 lakh contracts) and the 24,800 strike (32.48 lakh contracts).
The maximum Put writing was placed at the 24,000 strike, which saw an addition of 22.99 lakh contracts, followed by the 24,700 and 24,500 strikes, which added 18.5 lakh and 16.43 lakh contracts, respectively. The maximum Put unwinding was seen at the 25,050 strike, which shed 16,350 contracts, followed by the 25,150 strike, which shed 13,725 contracts.
5) Bank Nifty Call Options Data
According to the monthly options data, the maximum Call open interest was seen at the 57,000 strike, with 18.59 lakh contracts. This can act as a key resistance level for the index in the short term. It was followed by the 56,000 strike (5.37 lakh contracts) and the 56,500 strike (4.62 lakh contracts).
Maximum Call writing was visible at the 56,000 strike (with the addition of 2.49 lakh contracts), followed by the 57,000 strike (1.94 lakh contracts), and the 55,500 strike (1.17 lakh contracts). There was hardly any Call unwinding seen in the 54,000-57,900 strike band.
6) Bank Nifty Put Options Data
On the Put side, the 57,000 strike holds the maximum Put open interest (with 14.3 lakh contracts), which can act as a key level for the index. This was followed by the 56,000 strike (7.41 lakh contracts) and the 55,000 strike (7.18 lakh contracts).
The maximum Put writing was observed at the 56,000 strike (which added 1.73 lakh contracts), followed by the 55,500 strike (1.43 lakh contracts) and the 54,000 strike (1.17 lakh contracts). The maximum Put unwinding was seen at the 56,900 strike, which shed 1,995 contracts, followed by the 56,700 and 57,600 strikes, which shed 315 and 70 contracts, respectively.
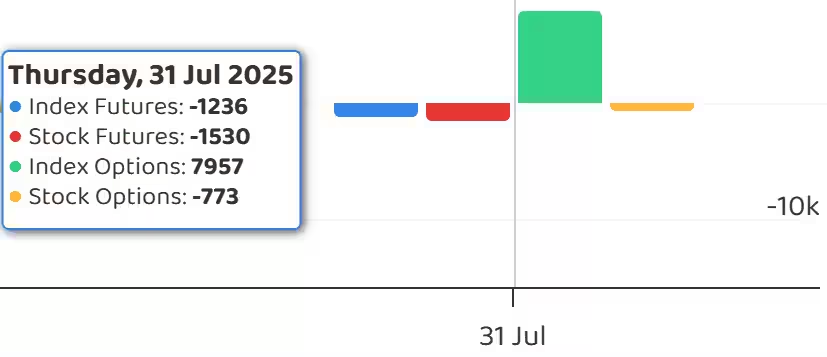
7) Funds Flow (Rs crore)
8) Put-Call Ratio
The Nifty Put-Call ratio (PCR), which indicates the mood of the market, advanced further to 1.04 on July 31, compared to 0.87 in the previous session.
The increasing PCR, or being higher than 0.7 or surpassing 1, means traders are selling more Put options than Call options, which generally indicates the firming up of a bullish sentiment in the market. If the ratio falls below 0.7 or moves towards 0.5, then it indicates selling in Calls is higher than selling in Puts, reflecting a bearish mood in the market.
9) India VIX
The India VIX, which measures expected market volatility, rebounded by 3.01 percent to 11.54, but remained in the lower zone. This indicates overall market stability and reduced uncertainty. However, low volatility levels can sometimes precede sharp moves in either direction, suggesting the possibility of a significant market move ahead.
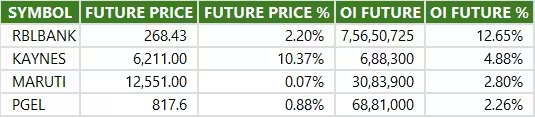
10) Long Build-up (4 Stocks)
A long build-up was seen in 4 stocks. An increase in open interest (OI) and price indicates a build-up of long positions.
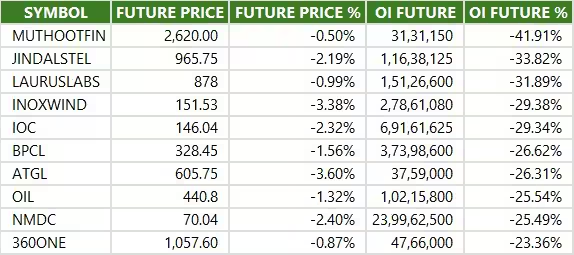
11) Long Unwinding (169 Stocks)
169 stocks saw a decline in open interest (OI) along with a fall in price, indicating long unwinding.
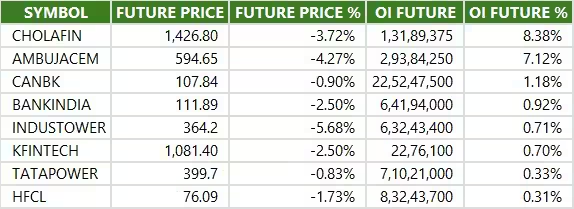
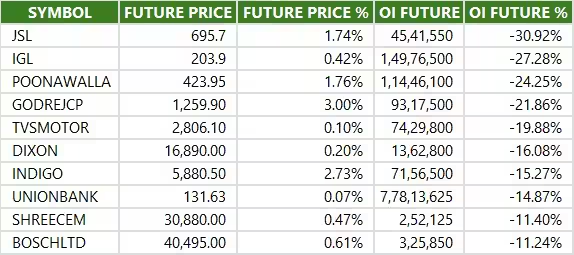
12) Short Build-up (8 Stocks)
8 stocks saw an increase in OI along with a fall in price, indicating a build-up of short positions.
13) Short-Covering (37 Stocks)
37 stocks saw short-covering, meaning a decrease in OI, along with a price increase.
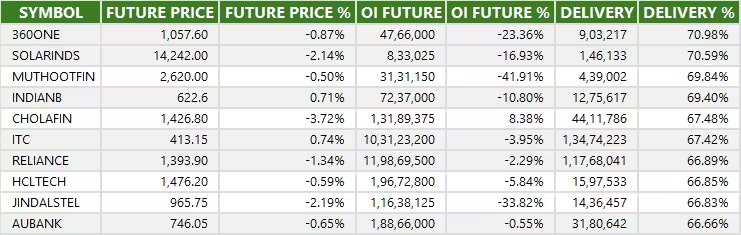
14) High Delivery Trades and High Rollovers
Here are the stocks that saw a high share of delivery trades. A high share of delivery reflects investing (as opposed to trading) interest in a stock.
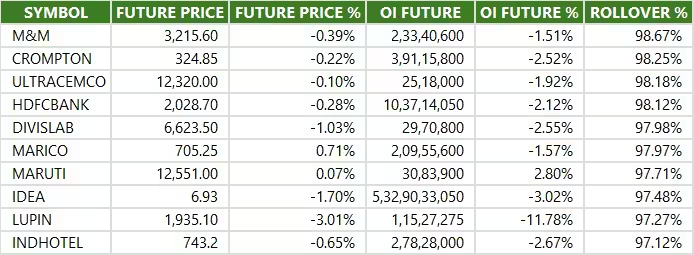
Here are the stocks which saw the highest rollovers on expiry day.
15) Stocks Under F&O Ban
Securities banned under the F&O segment include companies where derivative contracts cross 95 percent of the market-wide position limit.
Stocks added to F&O ban: Nil
Stocks retained in F&O ban: Nil
Stocks removed from F&O ban: Nil


0 Comment