14 Jul , 2025 By : Debdeep Gupta

The Nifty 50 extended its southward journey for the third consecutive session and decisively broke the midline of the Bollinger Bands (which generally acts as a support), as well as the previous week's low, falling 0.8 percent after a gap-down opening on July 11. Given the bearish bias in momentum indicators and the weak technical structure, the index is likely to fall toward the 25,000 mark, the next support zone. A further decline toward 24,900–24,800 cannot be ruled out. However, if it manages to defend Friday's low, 25,300 will be the immediate resistance to watch, followed by 25,500, according to experts.
Here are 15 data points we have collated to help you spot profitable trades:
1) Key Levels For The Nifty 50 (25,150)
Resistance based on pivot points: 25,274, 25,320, and 25,394
Support based on pivot points: 25,127, 25,081, and 25,007
Special Formation: The Nifty 50 formed a bearish candle on the daily charts and a long red candle on the weekly timeframe. The index traded below short-term moving averages (10- and 20-day EMAs), signaling a negative trend. The MACD sustained a negative crossover with a further weakening histogram, while the RSI dropped below the 50 mark to 48.75, with a negative crossover. The Stochastic RSI entered the oversold zone with a negative crossover. This suggests that momentum has weakened, although a rebound amid consolidation cannot be ruled out.
2) Key Levels For The Bank Nifty (56,755)
Resistance based on pivot points: 57,002, 57,117, and 57,301
Support based on pivot points: 56,633, 56,519, and 56,335
Resistance based on Fibonacci retracement: 57,566, 58,224
Support based on Fibonacci retracement: 56,389, 56,096
Special Formation: The Bank Nifty reported a bearish candle with a long upper shadow and a small lower shadow on the daily timeframe, signaling pressure at higher levels, though some buying emerged at lower levels. The index defended the 20-day EMA and the midline of the Bollinger Bands on a closing basis. It also held the previous week's low of the 56,600 zone. The MACD maintained a negative crossover with further weakness in the histogram, while the RSI at 53.27 also indicated weakness. The Stochastic RSI entered the oversold zone. Hence, consolidation and range-bound trading seem likely.
3) Nifty Call Options Data
According to the weekly options data, the 25,500 strike holds the maximum Call open interest (with 1.07 crore contracts). This level can act as a key resistance for the Nifty in the short term. It was followed by the 26,000 strike (1.02 crore contracts), and the 25,300 strike (98.92 lakh contracts).
Maximum Call writing was observed at the 25,300 strike, which saw an addition of 88.59 lakh contracts, followed by the 25,200 and 26,000 strikes, which added 52.84 lakh and 50.5 lakh contracts, respectively. There was hardly any Call unwinding seen in the 24,400-26,050 strike band.
4) Nifty Put Options Data
On the Put side, the maximum Put open interest was observed at the 25,000 strike (with 73.64 lakh contracts), which can act as a key support level for the Nifty. It was followed by the 25,200 strike (40.72 lakh contracts) and the 24,500 strike (36.34 lakh contracts).
The maximum Put writing was placed at the 25,000 strike, which saw an addition of 36.81 lakh contracts, followed by the 24,800 and 25,200 strikes, which added 14.84 lakh and 14.24 lakh contracts, respectively. The maximum Put unwinding was seen at the 25,400 strike, which shed 10.37 lakh contracts, followed by the 25,500 and 25,350 strikes, which shed 6.46 lakh and 6.29 lakh contracts, respectively.
5) Bank Nifty Call Options Data
According to the monthly options data, the maximum Call open interest was seen at the 56,000 strike, with 13.85 lakh contracts. This can act as a key level for the index in the short term. It was followed by the 57,000 strike (12.55 lakh contracts) and the 57,500 strike (10.38 lakh contracts).
Maximum Call writing was visible at the 56,800 strike (with the addition of 91,630 contracts), followed by the 56,900 strike (72,730 contracts), and the 56,700 strike (67,515 contracts). The maximum Call unwinding was seen at the 57,500 strike, which shed 27,685 contracts, followed by the 57,300 and 57,200 strikes, which shed 22,155 and 18,375 contracts, respectively.
6) Bank Nifty Put Options Data
On the Put side, the 56,000 strike sustains the maximum Put open interest (with 21.46 lakh contracts), which can act as a key support level for the index. This was followed by the 57,000 strike (11.24 lakh contracts) and the 55,000 strike (8.41 lakh contracts).
The maximum Put writing was observed at the 56,900 strike (which added 57,540 contracts), followed by the 56,700 strike (41,790 contracts) and the 55,200 strike (25,725 contracts). The maximum Put unwinding was seen at the 57,000 strike, which shed 1.08 lakh contracts, followed by the 55,000 and 57,100 strikes, which shed 46,200 and 39,865 contracts, respectively.
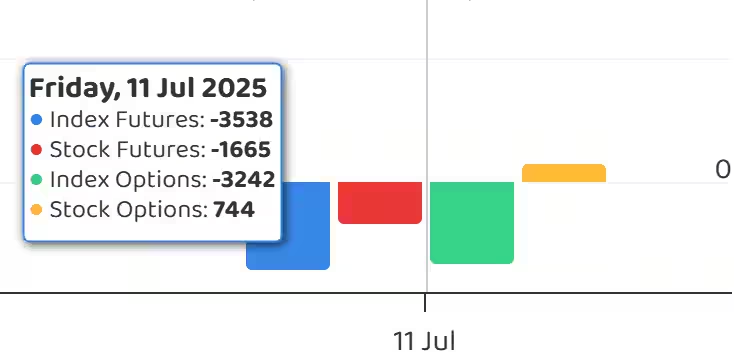
7) Funds Flow (Rs crore)
8) Put-Call Ratio
The Nifty Put-Call ratio (PCR), which indicates the mood of the market, dropped to 0.76 on July 11, compared to 0.97 in the previous session.
The increasing PCR, or being higher than 0.7 or surpassing 1, means traders are selling more Put options than Call options, which generally indicates the firming up of a bullish sentiment in the market. If the ratio falls below 0.7 or moves towards 0.5, then it indicates selling in Calls is higher than selling in Puts, reflecting a bearish mood in the market.
9) India VIX
The fear gauge, India VIX, remained in the lower zone despite rising by 1.24 percent to 11.82 levels after a three-day downtrend. This is generally considered a supportive zone for the bulls.
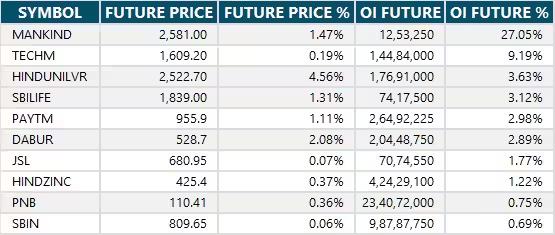
10) Long Build-up (14 Stocks)
A long build-up was seen in 14 stocks. An increase in open interest (OI) and price indicates a build-up of long positions.
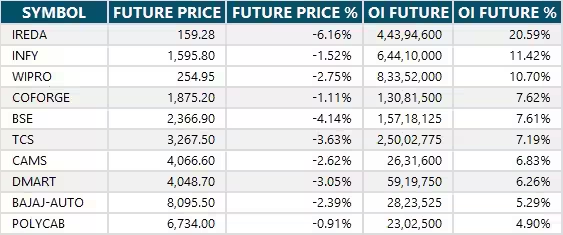
11) Long Unwinding (68 Stocks)
68 stocks saw a decline in open interest (OI) along with a fall in price, indicating long unwinding.
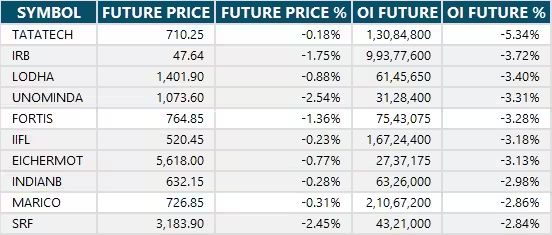
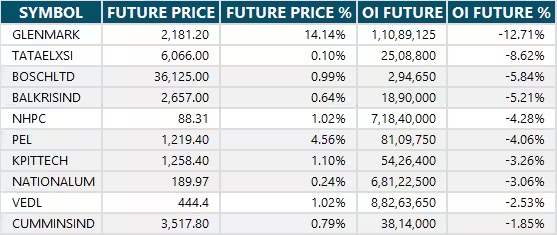
12) Short Build-up (111 Stocks)
111 stocks saw an increase in OI along with a fall in price, indicating a build-up of short positions.
13) Short-Covering (33 Stocks)
33 stocks saw short-covering, meaning a decrease in OI, along with a price increase.
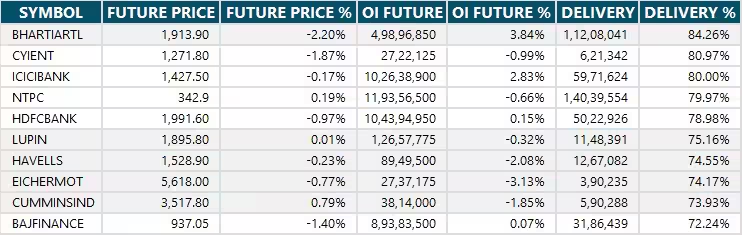
14) High Delivery Trades
Here are the stocks that saw a high share of delivery trades. A high share of delivery reflects investing (as opposed to trading) interest in a stock.
15) Stocks Under F&O Ban
Securities banned under the F&O segment include companies where derivative contracts cross 95 percent of the market-wide position limit.
Stocks added to F&O ban: Glenmark Pharma
Stocks retained in F&O ban: Hindustan Copper, RBL Bank
Stocks removed from F&O ban: Nil


0 Comment