09 Jun , 2025 By : Debdeep Gupta

The Nifty 50 staged a strong performance on June 6, soaring 1 percent following the RBI's surprise move. The decline in the India VIX below the 15 mark also provided comfort to the bulls. Furthermore, the index traded well above all key moving averages, with a positive crossover in the RSI, and is on the verge of breaking out of a declining resistance trendline. According to experts, the levels to watch are 25,200–25,300, which coincide with the 78.6 percent Fibonacci retracement (of the 26,277–21,744 range) on the higher side, while support is seen at the 24,800–24,700 zones, followed by 24,500 as a key support.
Here are 15 data points we have collated to help you spot profitable trades:
1) Key Levels For The Nifty 50 (25,003)
Resistance based on pivot points: 25,038, 25,123, and 25,259
Support based on pivot points: 24,765, 24,680, and 24,543
Special Formation: The Nifty 50 formed a long bullish candle on the daily charts, continuing its higher highs–higher lows formation, indicating a positive trend. With Friday's rally, the index traded well above all key moving averages (10-, 20-, 50-, and 200-day EMAs). The RSI, at 60.03, showed a positive crossover, and the Stochastic RSI also maintained a positive crossover, while the MACD inclined upward and remained well above the zero line with an improving histogram.
2) Key Levels For The Bank Nifty (56,578)
Resistance based on pivot points: 56,713, 56,986, and 57,430
Support based on pivot points: 55,826, 55,552, and 55,109
Resistance based on Fibonacci retracement: 58,648, 65,412
Support based on Fibonacci retracement: 54,573, 53,260
Special Formation: The Bank Nifty reported a long bullish candlestick pattern on the daily timeframe with above-average volumes, following a breakout from the resistance trendline. The index climbed above the upper line of the Bollinger Bands and traded well above all key moving averages. The RSI and Stochastic RSI showed positive crossovers, while the MACD inclined upward with an improving histogram.
3) Nifty Call Options Data
According to the weekly options data, the maximum Call open interest was seen at the 26,000 strike (with 1.08 crore contracts). This level can act as a key resistance for the Nifty in the short term. It was followed by the 25,500 strike (78.97 lakh contracts), and the 25,000 strike (55.38 lakh contracts).
Maximum Call writing was observed at the 25,500 strike, which saw an addition of 32.46 lakh contracts, followed by the 25,600 and 26,000 strikes, which added 30.52 lakh and 23.71 lakh contracts, respectively. The maximum Call unwinding was seen at the 24,800 strike, which shed 12.3 lakh contracts, followed by the 24,700 and 24,600 strikes which shed 5.64 lakh and 1.99 lakh contracts, respectively.
4) Nifty Put Options Data
On the Put side, the 25,000 strike holds the maximum Put open interest (with 62.6 lakh contracts), which can act as a key support level for the Nifty. It was followed by the 24,700 strike (59 lakh contracts) and the 24,800 strike (56.99 lakh contracts).
The maximum Put writing was placed at the 25,000 strike, which saw an addition of 51.61 lakh contracts, followed by the 24,900 and 24,600 strikes, which added 34.68 lakh and 28.67 lakh contracts, respectively. There was hardly any Put unwinding seen in the 24,100-26,050 strike band.
5) Bank Nifty Call Options Data
According to the monthly options data, the maximum Call open interest was seen at the 56,000 strike, with 19.02 lakh contracts. This can act as a key level for the index in the short term. It was followed by the 57,000 strike (10.7 lakh contracts) and the 58,000 strike (9.57 lakh contracts).
Maximum Call writing was visible at the 58,000 strike (with the addition of 1.88 lakh contracts), followed by the 58,500 strike (1.69 lakh contracts), and the 56,500 strike (1.26 lakh contracts). The maximum Call unwinding was seen at the 56,000 strike, which shed 3.75 lakh contracts, followed by the 55,900 and 55,800 strikes, which shed 1.44 lakh and 1.37 lakh contracts, respectively.
6) Bank Nifty Put Options Data
On the Put side, the 56,000 strike holds the maximum Put open interest (with 19.72 lakh contracts), which can act as a key support level for the index. This was followed by the 55,000 strike (13.78 lakh contracts) and the 55,500 strike (7.65 lakh contracts).
The maximum Put writing was observed at the 56,500 strike (which added 5.5 lakh contracts), followed by the 56,000 strike (2.86 lakh contracts) and the 55,000 strike (2.42 lakh contracts). The maximum Put unwinding was seen at the 55,700 strike, which shed 15,990 contracts, followed by the 55,200 and 55,300 strikes, which shed 9,180 and 3,570 contracts, respectively.
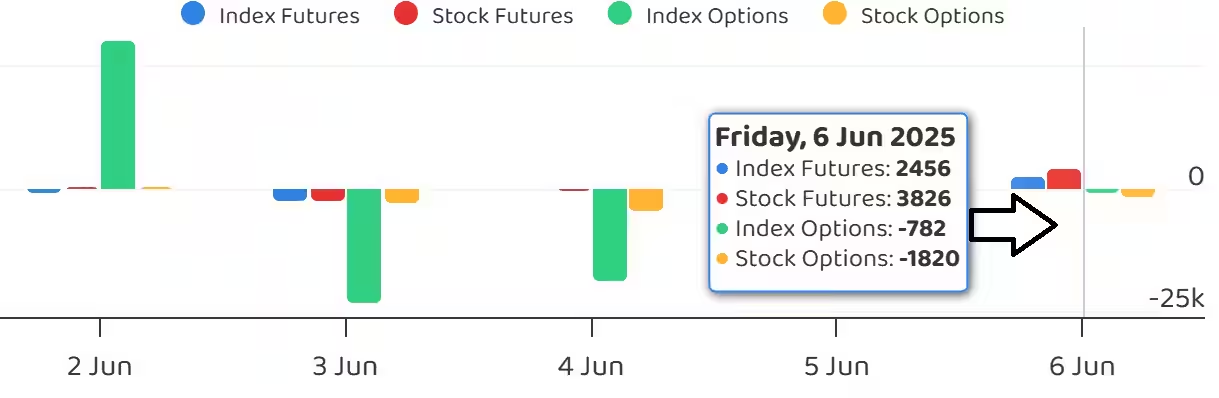
7) Funds Flow (Rs crore)
8) Put-Call Ratio
The Nifty Put-Call ratio (PCR), which indicates the mood of the market, rose to 1.05 on June 6, from 0.98 in the previous session.
The increasing PCR, or being higher than 0.7 or surpassing 1, means traders are selling more Put options than Call options, which generally indicates the firming up of a bullish sentiment in the market. If the ratio falls below 0.7 or moves towards 0.5, then it indicates selling in Calls is higher than selling in Puts, reflecting a bearish mood in the market.
9) India VIX
The India VIX, the fear index, maintained a downward bias for the fourth consecutive session, falling 3 percent to 14.63 levels (a fresh two-month low) on Friday, providing additional comfort for bulls. The index traded well below all key moving averages.
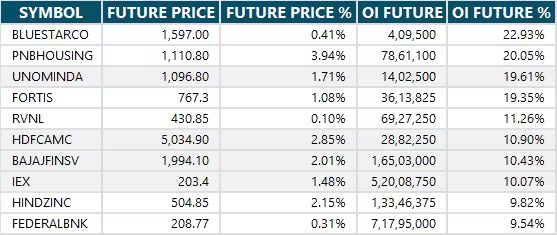
10) Long Build-up (92 Stocks)
A long build-up was seen in 92 stocks. An increase in open interest (OI) and price indicates a build-up of long positions.
11) Long Unwinding (18 Stocks)
18 stocks saw a decline in open interest (OI) along with a fall in price, indicating long unwinding.
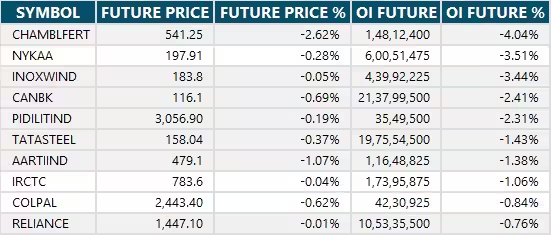
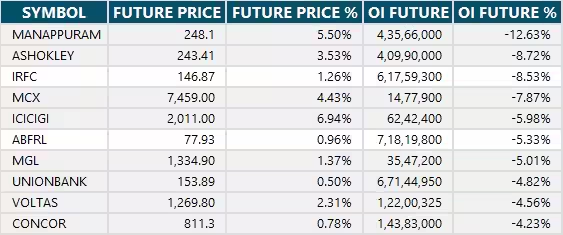
12) Short Build-up (31 Stocks)
31 stocks saw an increase in OI along with a fall in price, indicating a build-up of short positions.
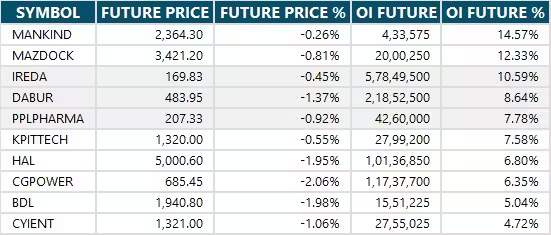
13) Short-Covering (84 Stocks)
84 stocks saw short-covering, meaning a decrease in OI, along with a price increase.
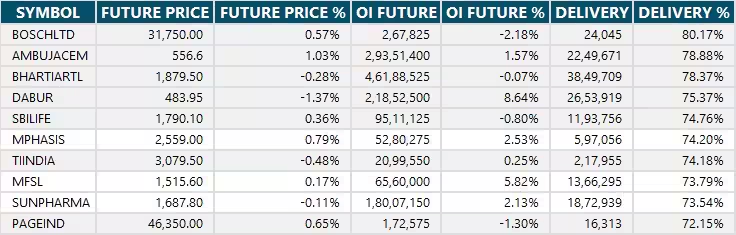
14) High Delivery Trades
Here are the stocks that saw a high share of delivery trades. A high share of delivery reflects investing (as opposed to trading) interest in a stock.
15) Stocks Under F&O Ban
Securities banned under the F&O segment include companies where derivative contracts cross 95 percent of the market-wide position limit.
Stocks added to F&O ban: Hindustan Copper
Stocks retained in F&O ban: Aditya Birla Fashion and Retail, Chambal Fertilisers and Chemicals, Manappuram Finance
Stocks removed from F&O ban: Nil


0 Comment