20 Feb , 2026 By : Debdeep Gupta

The Nifty 50 came under significant selling pressure after a three-day winning streak, falling over 1.4 percent on February 19 following a rally in oil prices amid geopolitical tensions between the US and Iran. The index fell below all key moving averages (except the 200-day EMA) in a single session. Weakening momentum and a rising VIX further dampened sentiment. If the index decisively breaks 25,400 in the upcoming sessions, a fall toward the 25,300–25,200 zone cannot be ruled out. However, holding above 25,400 could take the index toward the 25,500–25,600 zone, according to experts.
Here are 15 data points we have collated to help you spot profitable trades:
1) Key Levels For The Nifty 50 (25,454)
Resistance based on pivot points: 25,766, 25,883, and 26,073
Support based on pivot points: 25,386, 25,269, and 25,080
Special Formation: The Nifty 50 formed a long bearish candle, almost engulfing the previous three days’ green candles on the daily chart, signalling the emergence of weakness. The index slipped decisively below the 20-, 50-, and 100-day EMAs in a single session, though it remained above the 200-day EMA. Momentum indicators also pointed to a negative bias, with the RSI at 45.60 falling below the reference line. The MACD is on the verge of a bearish crossover, while the histogram suggests fading momentum. All this indicates weakening strength in the index.
2) Key Levels For The Bank Nifty (60,740)
Resistance based on pivot points: 61,419, 61,675, and 62,090
Support based on pivot points: 60,589, 60,333, and 59,918
Resistance based on Fibonacci retracement: 62,077, 64,731
Support based on Fibonacci retracement: 60,197, 59,730
Special Formation: The Bank Nifty also formed a long red candle, which engulfed the previous two green candles on the daily timeframe, signalling nervousness. The index continued to defend all key moving averages while testing the 10-day EMA intraday. The RSI dropped to 55.53 and fell below the signal line. The Stochastic RSI also turned bearish. The MACD inclined downward but remained above the reference line, with the histogram showing fading momentum. All this indicates caution in the near term.
3) Nifty Call Options Data
According to the monthly options data, the 26,000 strike holds the maximum Call open interest (with 1.48 crore contracts). This level can act as a key resistance level for the Nifty in the short term. It was followed by the 25,800 strike (1.46 crore contracts) and 25,700 strike (1.23 crore contracts).
Maximum Call writing was observed at the 25,600 strike, which saw an addition of 91.2 lakh contracts, followed by the 25,800 and 25,700 strikes, which added 85.02 lakh and 77.84 lakh contracts, respectively. The maximum Call unwinding was seen at the 24,700 strike which shed 3,575 contracts, followed by the 24,800 and 24,750 strikes, which shed 1,365 and 650 contracts, respectively.
4) Nifty Put Options Data
On the Put side, the maximum Put open interest was seen at the 25,000 strike (with 1.02 crore contracts), which can act as a key support level for the Nifty in the short term. It was followed by the 24,800 strike (62.63 lakh contracts) and the 25,400 strike (60.6 lakh contracts).
The maximum Put writing was placed at the 24,800 strike, which saw an addition of 28.15 lakh contracts, followed by the 25,000 and 25,100 strikes, which added 17.43 lakh and 12.51 lakh contracts, respectively. The maximum Put unwinding was seen at the 25,700 strike, which shed 55.6 lakh contracts, followed by the 25,500 and 25,600 strikes, which shed 33.78 lakh and 29.49 lakh contracts, respectively.
5) Bank Nifty Call Options Data
According to the monthly options data, the 61,000 strike holds the maximum Call open interest, with 11.24 lakh contracts. This can act as a key resistance level for the index in the short term. It was followed by the 61,500 strike (9.56 lakh contracts) and the 60,000 strike (8.97 lakh contracts).
Maximum Call writing was observed at the 61,000 strike (with the addition of 5.23 lakh contracts), followed by the 61,500 strike (1.61 lakh contracts) and 60,800 strike (1.52 lakh contracts). The maximum Call unwinding was seen at the 60,000 strike, which shed 3.77 lakh contracts, followed by the 62,300 and 62,100 strikes which shed 56,280 and 21,390 contracts, respectively.
6) Bank Nifty Put Options Data
On the Put side, the maximum Put open interest was seen at the 60,000 strike (with 13.64 lakh contracts), which can act as a key support level for the index. This was followed by the 60,500 strike (8.82 lakh contracts) and the 61,000 strike (6.33 lakh contracts).
The maximum Put writing was placed at the 59,800 strike (which added 2,790 contracts), followed by the 62,100 strike (690 contracts) and the 62,300 strike (180 contracts). The maximum Put unwinding was seen at the 60,000 strike, which shed 9.05 lakh contracts, followed by the 61,000 and 61,500 strikes, which shed 5.53 lakh and 3.21 lakh contracts, respectively.
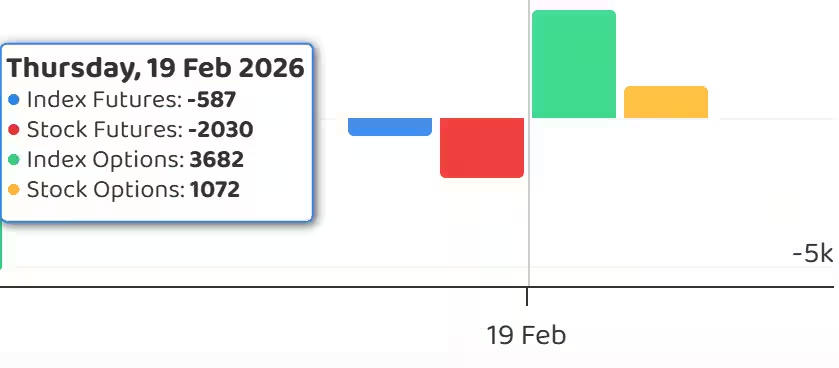
7) Funds Flow (Rs crore)
8) Put-Call Ratio
The Nifty Put-Call ratio (PCR), which indicates the mood of the market, fell sharply to 0.7 on February 19, compared to 1.22 in the previous session.
The increasing PCR, or being higher than 0.7 or surpassing 1, means traders are selling more Put options than Call options, which generally indicates the firming up of a bullish sentiment in the market. If the ratio falls below 0.7 or moves towards 0.5, then it indicates selling in Calls is higher than selling in Puts, reflecting a bearish mood in the market.
9) India VIX
The India VIX, also known as the fear index, climbed back above the crucial 13 zone as well as all key moving averages, rising 10.12 percent to 13.46, which signalled discomfort for bulls. As long as the VIX stays above the 13 zone, bulls need to remain cautious.
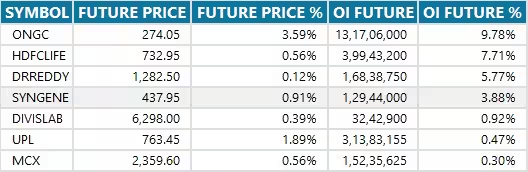
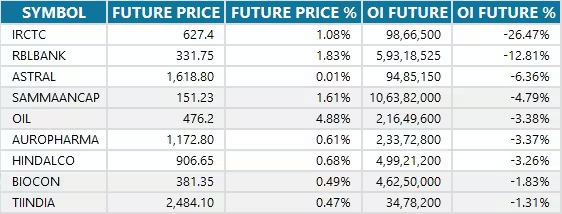
10) Long Build-up (7 Stocks)
A long build-up was seen in 7 stocks. An increase in open interest (OI) and price indicates a build-up of long positions.
11) Long Unwinding (129 Stocks)
129 stocks saw a decline in open interest (OI) along with a fall in price, indicating long unwinding.
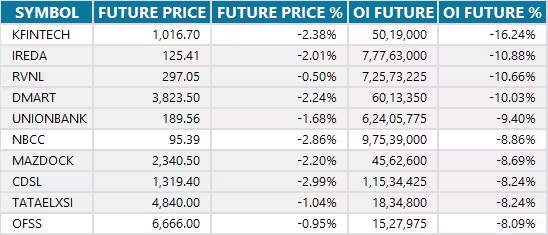
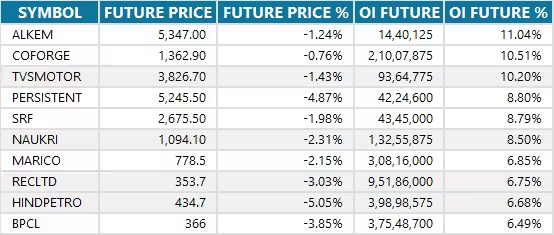
12) Short Build-up (67 Stocks)
67 stocks saw an increase in OI along with a fall in price, indicating a build-up of short positions.
13) Short-Covering (9 Stocks)
9 stocks saw short-covering, meaning a decrease in OI, along with a price increase.
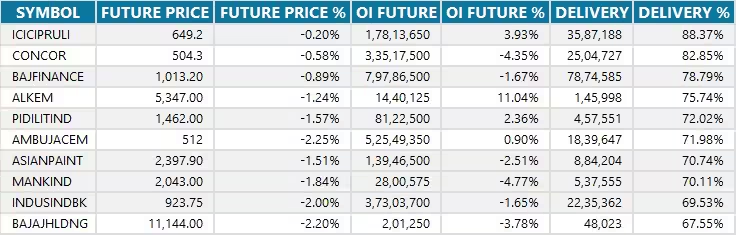
14) High Delivery Trades
Here are the stocks that saw a high share of delivery trades. A high share of delivery reflects investing (as opposed to trading) interest in a stock.
15) Stocks Under F&O Ban
Securities banned under the F&O segment include companies where derivative contracts cross 95 percent of the market-wide position limit.
Stocks added to F&O ban: Nil
Stocks retained in F&O ban: SAIL, Sammaan Capital
Stocks removed from F&O ban: Nil


0 Comment