11 Feb , 2025 By : Debdeep Gupta

The downtrend continued in the equity markets for the fourth consecutive session on February 10. The benchmark Nifty 50 declined by 178 points, maintaining the pattern of lower tops and lower bottoms for the third day, but defended the midline of the Bollinger Bands placed at the 23,300 zone. If the index manages to defend the 23,300 level, it may face resistance in the range of 23,450-23,500, followed by 23,600 (the 200-day EMA) as key resistance. However, if 23,300 is broken, it could drag the index down to 23,200 (the low of February 3), which is considered a key support area, according to experts.
Here are 15 data points we have collated to help you spot profitable trades:
1) Key Levels For The Nifty 50 (23,382)
Resistance based on pivot points: 23,519, 23,578, and 23,674
Support based on pivot points: 23,326, 23,266, and 23,170
Special Formation: The Nifty 50 reported a bearish candlestick pattern on the daily charts and closed at the 50% Fibonacci retracement of 23,300 (from the January low of 22,787 to the February high of 23,807). This level somewhat coincides with Monday's low, as well as the midline of the Bollinger Bands. Generally, this is considered a key support level and raises the possibility of a rebound from it. However, breaking this level could give more strength to the bears.
2) Key Levels For The Bank Nifty (49,981)
Resistance based on pivot points: 50,119, 50,226, and 50,399
Support based on pivot points: 49,774, 49,667, and 49,494
Resistance based on Fibonacci retracement: 50,380, 51,149
Support based on Fibonacci retracement: 49,286, 47,866
Special Formation: The Bank Nifty formed a small bearish candle with a minor upper shadow and a long lower shadow on the daily timeframe. This indicates healthy buying interest at lower levels, though there was some pressure at higher levels, and the index closed with a loss of 178 points on Monday. Additionally, the index defended its short-term moving averages (10 and 20-day EMAs), as well as the upward-sloping support trendline on a closing basis, which is a supportive factor.
3) Nifty Call Options Data
According to the weekly options data, the 24,000 strike holds the maximum Call open interest (with 1.22 crore contracts). This level can act as a key resistance for the Nifty in the short term. It was followed by the 24,500 strike (88.17 lakh contracts) and the 23,700 strike (81.28 lakh contracts).
Maximum Call writing was observed at the 24,000 strike, which saw an addition of 38.2 lakh contracts, followed by the 23,700 and 24,100 strikes, which added 34.77 lakh and 33.21 lakh contracts, respectively. The maximum Call unwinding was seen at the 24,450 strike which shed 70,275 contracts, followed by the 22,750 and 22,700 strikes which shed 1,425 and 900 contracts, respectively.
4) Nifty Put Options Data
On the Put side, the maximum Put open interest was seen at the 22,500 strike (with 77.75 lakh contracts), which can act as a key support level for the Nifty. It was followed by the 22,800 strike (54.74 lakh contracts) and the 22,700 strike (53.43 lakh contracts).
The maximum Put writing was placed at the 23,100 strike, which saw an addition of 27.04 lakh contracts, followed by the 22,800 and 23,400 strikes, which added 18.23 lakh and 13.98 lakh contracts, respectively. The maximum Put unwinding was seen at the 23,500 strike, which shed 10.13 lakh contracts, followed by the 23,200 and 23,600 strikes, which shed 7.1 lakh and 5.3 lakh contracts, respectively.
5) Bank Nifty Call Options Data
According to the monthly options data, the maximum Call open interest was seen at the 52,000 strike, with 18.65 lakh contracts. This can act as a key resistance level for the index in the short term. It was followed by the 51,000 strike (13.09 lakh contracts) and the 50,000 strike (9.13 lakh contracts).
Maximum Call writing was visible at the 50,000 strike (with the addition of 1.82 lakh contracts), followed by the 51,500 strike (57,840 contracts) and the 50,100 strike (45,420 contracts). The maximum Call unwinding was seen at the 48,500 strike, which shed 26,250 contracts, followed by the 50,400 and 49,000 strikes, which shed 15,690 and 12,390 contracts, respectively.
6) Bank Nifty Put Options Data
On the Put side, the 49,000 strike holds the maximum Put open interest (with 13.14 lakh contracts), which can act as a key support level for the index. This was followed by the 50,000 strike (11.44 lakh contracts) and the 48,500 strike (7.82 lakh contracts).
The maximum Put writing was observed at the 49,800 strike (which added 1.06 lakh contracts), followed by the 50,000 strike (88,980 contracts) and the 49,500 strike (49,770 contracts). The maximum Put unwinding was seen at the 49,000 strike, which shed 85,470 contracts, followed by the 50,500 and 50,400 strikes which shed 76,950 and 29,970 contracts, respectively.
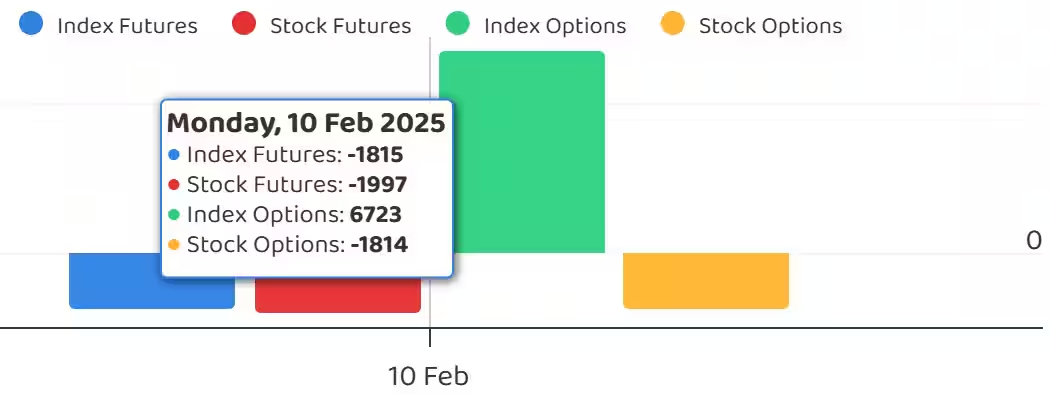
7) Funds Flow (Rs crore)
8) Put-Call Ratio
The Nifty Put-Call ratio (PCR), which indicates the mood of the market, dropped to 0.75 on February 10, against 0.83 in the previous session.
The increasing PCR, or being higher than 0.7 or surpassing 1, means traders are selling more Put options than Call options, which generally indicates the firming up of a bullish sentiment in the market. If the ratio falls below 0.7 or moves towards 0.5, then it indicates selling in Calls is higher than selling in Puts, reflecting a bearish mood in the market.
9) India VIX
The volatility index, India VIX, which measures expected market volatility, rebounded by 5.55% to 14.44, signaling some caution for the bulls. However, it has remained within a small range for the last six consecutive sessions.
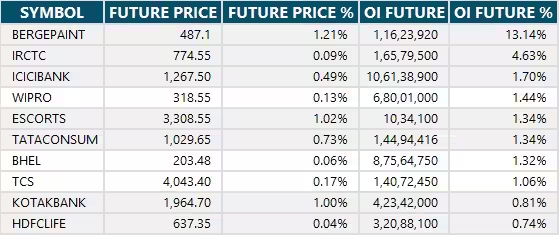
10) Long Build-up (15 Stocks)
A long build-up was seen in 15 stocks. An increase in open interest (OI) and price indicates a build-up of long positions.
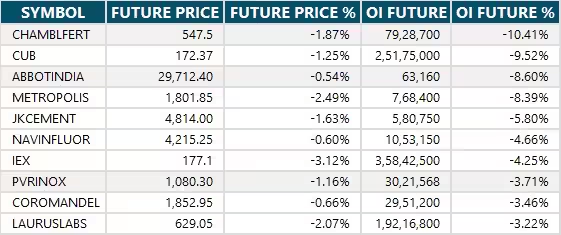
11) Long Unwinding (72 Stocks)
72 stocks saw a decline in open interest (OI) along with a fall in price, indicating long unwinding.
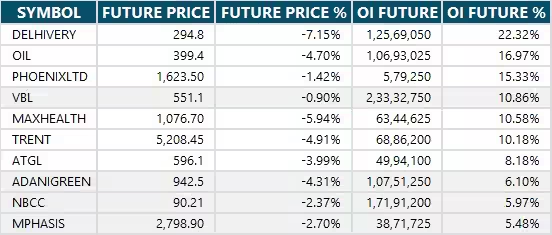
12) Short Build-up (134 Stocks)
134 stocks saw an increase in OI along with a fall in price, indicating a build-up of short positions.
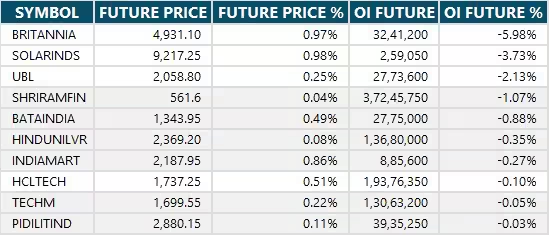
13) Short-Covering (10 Stocks)
10 stocks saw short-covering, meaning a decrease in OI, along with a price increase.
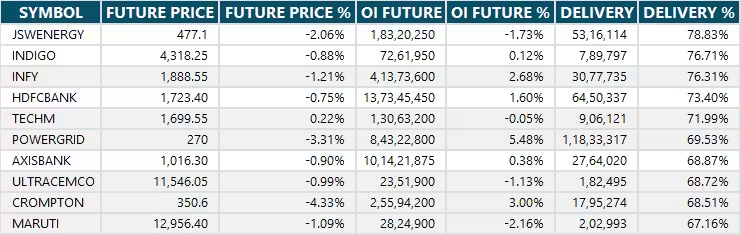
14) High Delivery Trades
Here are the stocks that saw a high share of delivery trades. A high share of delivery reflects investing (as opposed to trading) interest in a stock.
15) Stocks Under F&O Ban
Securities banned under the F&O segment include companies where derivative contracts cross 95 percent of the market-wide position limit.
Stocks added to F&O ban: Nil
Stocks retained in F&O ban: Manappuram Finance
Stocks removed from F&O ban: Nil


0 Comment