13 Jun , 2024 By : Debdeep Gupta

Godrej Properties Limited shares have given a horizontal trendline breakout on the daily scale, confirmed by robust volume.
According to Sudeep Shah, DVP and Head of Derivative and Technical Research at SBI Securities, "the stock is trading at an all-time high level, and all the moving averages and momentum-based indicators suggest strong bullish momentum in the stock."
He suggests implementing a bull call option spread strategy to capture the upside.
Derivatives strategy for Godrej Properties stock: Bull Call Spread
Position: Godrej Properties Spread Trade (Bull Spread: 27th June expiry)
Buy 3,040 CE (call option) at CMP (current market price) Rs 91
Sell 3,060 CE at CMP Rs 82
Net Outflow (Max Risk): 9 points
Date of Initiation: 13 June
Date of Expiry: 27 June
Maximum Potential Risk: 9 points (Rs 4275 Per Pair)
Maximum Potential Gain: 11 points (Rs 5225)
Profitable Zone: If the stock remains above 3049
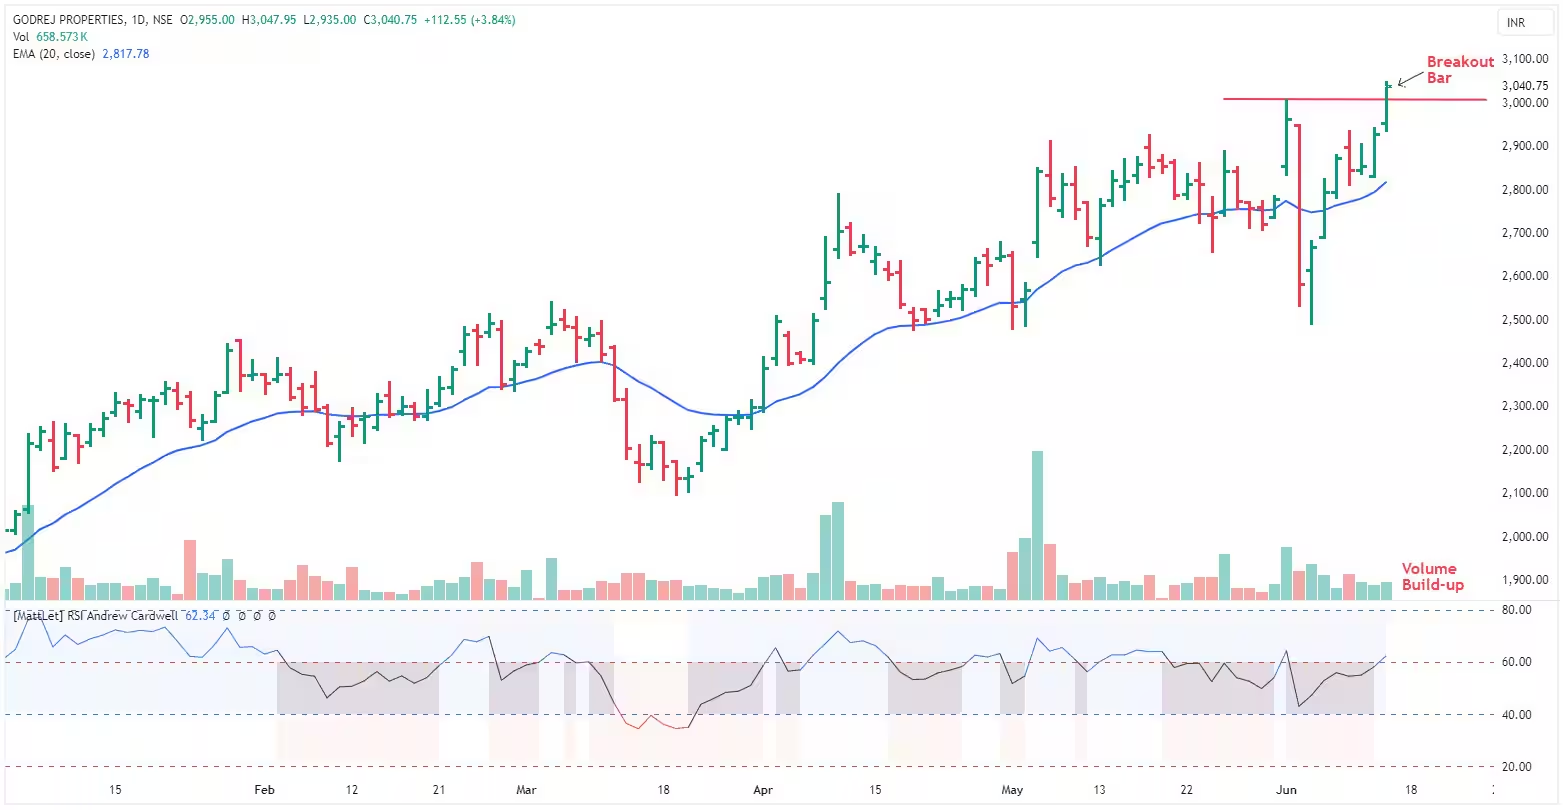
Technical chart of Godrej Properties | Source: SBI Securities
Technical Setup
"The Mansfield’s Relative Strength indicator has been quoting above the zero line for the last 289 trading sessions, indicating strong outperformance compared to the broader market, i.e., Nifty 500," said Shah.
On the Derivatives Front:
The current derivative data aligns with the existing bullish chart structure. The June futures have seen an uptick of over 2 percent in Wednesday’s trading session. "The cumulative open interest across the current, next, and far series has surged by over 1 percent. This suggests a build-up of long positions, reflecting the prevailing optimism among market participants," said Shah.
A significant concentration of call open interest is evident at Rs 3,100 strike, while substantial open interest on the put side is concentrated at Rs 2,900 strike. "Delving into the option chain, there has been a discernible accumulation of long positions from 3,200 to 2,980 call strikes. Conversely, on the put side, there is noteworthy put writing observed from 3,000 to 2,840 strikes. This clearly indicates bullish momentum in the stock," he added.
Shah said this collective data suggests a bullish sentiment in stock leading to it testing the level of 3160, followed by 3210 in short-term.


0 Comment