08 Sep , 2025 By : Debdeep Gupta

The Nifty 50 closed its rangebound session flat with a positive bias on September 5, after buying interest emerged at lower levels. Following its recent recovery from 24,400, the index attempted to reach 25,000 on Thursday, but the effort fell short. In the upcoming sessions, the index is expected to remain rangebound between 24,500 and 25,000. A breakdown below this range could lead to a test of the key support zone at 24,400–24,300. On the other hand, a decisive breakout above 25,000 could open the door for a rally toward the 25,200–25,250 levels, according to experts.
Here are 15 data points we have collated to help you spot profitable trades:
1) Key Levels For The Nifty 50 (24,741)
Resistance based on pivot points: 24,812, 24,862, and 24,942
Support based on pivot points: 24,651, 24,601, and 24,521
Special Formation: The Nifty 50 formed a bearish candlestick with a long lower shadow on the daily timeframe, indicating underlying bearishness but also buying interest at lower levels. The index closed slightly above the 20-day EMA as well as the midline of the Bollinger Bands, and managed to defend the 100-day EMA. However, it failed to hold above the 50-day EMA, which remains crucial for any further upward movement. The MACD showed a positive crossover, although it still remains below the zero line, while the histogram continued to gain. The RSI reached 49.31 and sustained a bullish crossover. This suggests a slightly positive bias in momentum but need to start trading above all key moving averages.
2) Key Levels For The Bank Nifty (54,115)
Resistance based on pivot points: 54,272, 54,411, and 54,636
Support based on pivot points: 53,823, 53,684, and 53,459
Resistance based on Fibonacci retracement: 54,521, 55,115
Support based on Fibonacci retracement: 53,393, 52,393
Special Formation: The Bank Nifty displayed a similar candlestick pattern, closing 0.07 percent higher. The banking index stayed well above the support trendline and the 200-day EMA, but remains well below the midline of the Bollinger Bands as well as the 20-day, 50-day, and 100-day EMAs. These moving averages are critical for any meaningful upmove, and until reclaimed, they continue to signal rangebound action. Both the MACD and RSI continued to show negative crossovers, though the Stochastic RSI maintained a bullish crossover.
3) Nifty Call Options Data
According to the weekly options data, the 25,000 strike holds the maximum Call open interest (with 1.86 crore contracts). This level can act as a key resistance for the Nifty in the short term. It was followed by the 25,500 strike (1.45 crore contracts), and the 24,900 strike (1.3 crore contracts).
Maximum Call writing was observed at the 25,100 strike, which saw an addition of 23.18 lakh contracts, followed by the 25,400 and 24,700 strikes, which added 17.18 lakh and 15.95 lakh contracts, respectively. The maximum Call unwinding was seen at the 24,900 strike, which shed 15.06 lakh contracts, followed by the 25,550 and 24,600 strikes, which shed 6.93 lakh and 4.51 lakh contracts, respectively.
4) Nifty Put Options Data
On the Put side, the maximum Put open interest was seen at the 24,000 strike (with 1.31 crore contracts), which can act as a key support level for the Nifty. It was followed by the 24,500 strike (1.23 crore contracts) and the 24,600 strike (98.47 lakh contracts).
The maximum Put writing was placed at the 24,000 strike, which saw an addition of 28.21 lakh contracts, followed by the 24,650 and 24,800 strikes, which added 19.97 lakh and 16.75 lakh contracts, respectively. The maximum Put unwinding was seen at the 24,250 strike, which shed 4.74 lakh contracts, followed by the 24,150 and 24,500 strikes, which shed 3.64 lakh and 2.51 lakh contracts, respectively.
5) Bank Nifty Call Options Data
According to the monthly options data, the maximum Call open interest was seen at the 56,000 strike, with 13.74 lakh contracts. This can act as a key resistance level for the index in the short term. It was followed by the 55,000 strike (13.4 lakh contracts) and the 54,000 strike (10.21 lakh contracts).
Maximum Call writing was observed at the 56,000 strike (with the addition of 84,210 contracts), followed by the 54,000 strike (66,345 contracts), and the 55,000 strike (64,785 contracts). The maximum Call unwinding was seen at the 55,500 strike, which shed 39,550 contracts, followed by 54,500 and 54,300 strikes, which shed 26,635 and 23,345 contracts, respectively.
6) Bank Nifty Put Options Data
On the Put side, the 54,000 strike holds the maximum Put open interest (with 12.93 lakh contracts), which can act as a key support level for the index. This was followed by the 53,000 strike (8.35 lakh contracts) and the 55,000 strike (7.54 lakh contracts).
The maximum Put writing was observed at the 55,000 strike (which added 58,905 contracts), followed by the 54,500 strike (24,080 contracts) and the 54,000 strike (21,425 contracts). The maximum Put winding was seen at the 53,000 strike, which shed 39,725 contracts, followed by the 53,900 and 54,300 strikes, which shed 22,435 and 19,250 contracts, respectively.
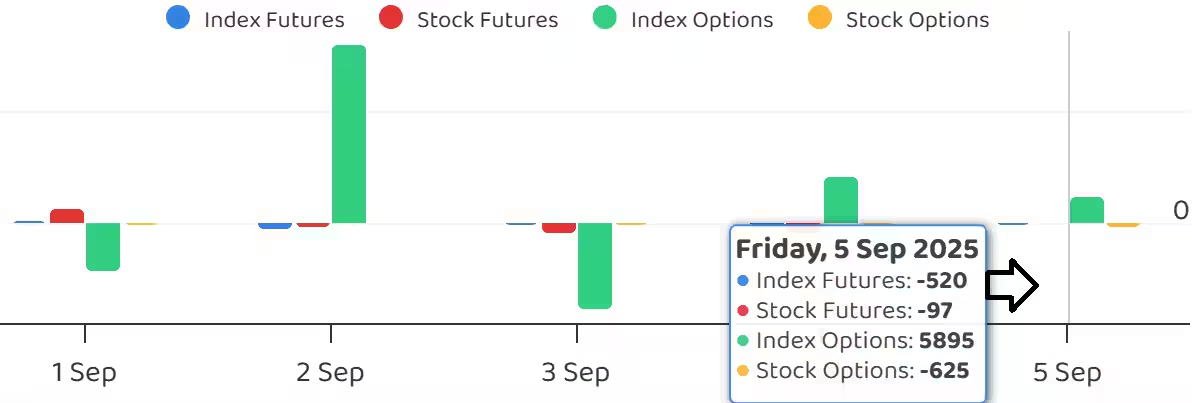
7) Funds Flow (Rs crore)
8) Put-Call Ratio
The Nifty Put-Call ratio (PCR), which indicates the mood of the market, rose sharply to 0.86 on September 05, compared to 0.84 in the previous session.
The increasing PCR, or being higher than 0.7 or surpassing 1, means traders are selling more Put options than Call options, which generally indicates the firming up of a bullish sentiment in the market. If the ratio falls below 0.7 or moves towards 0.5, then it indicates selling in Calls is higher than selling in Puts, reflecting a bearish mood in the market.
9) India VIX
The India VIX, which measures expected market volatility, declined by 0.67 percent to 10.78, marking its lowest closing level since July 24. This generally reflects comfort for bulls in a less uncertain environment. However, being at such low levels, it cannot rule out sharp moves on either side of the trade.
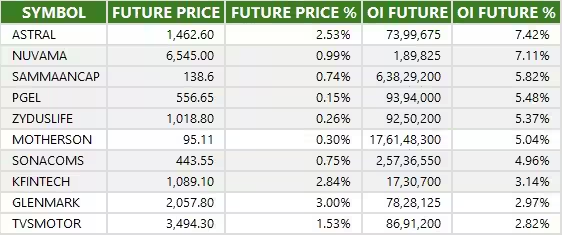
10) Long Build-up (61 Stocks)
A long build-up was seen in 61 stocks. An increase in open interest (OI) and price indicates a build-up of long positions.
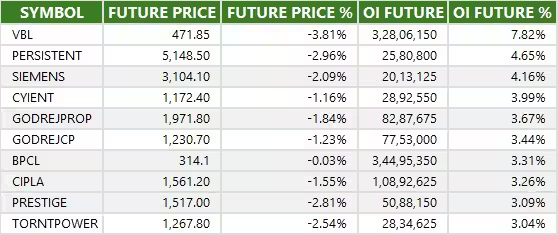
11) Long Unwinding (18 Stocks)
18 stocks saw a decline in open interest (OI) along with a fall in price, indicating long unwinding.
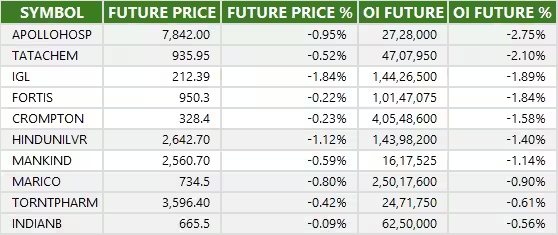
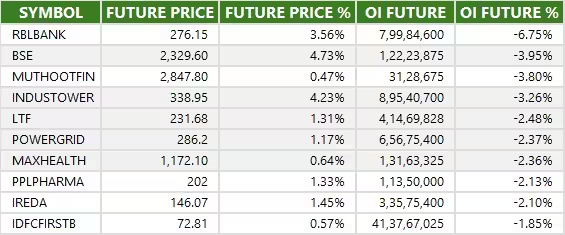
12) Short Build-up (67 Stocks)
67 stocks saw an increase in OI along with a fall in price, indicating a build-up of short positions.
13) Short-Covering (66 Stocks)
66 stocks saw short-covering, meaning a decrease in OI, along with a price increase.
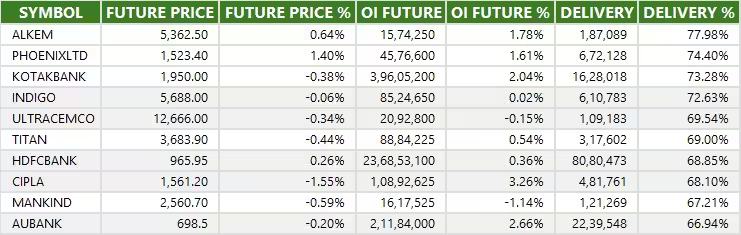
14) High Delivery Trades
Here are the stocks that saw a high share of delivery trades. A high share of delivery reflects investing (as opposed to trading) interest in a stock.
15) Stocks Under F&O Ban
Securities banned under the F&O segment include companies where derivative contracts cross 95 percent of the market-wide position limit.
Stocks added to F&O ban: Nil
Stocks retained in F&O ban: RBL Bank
Stocks removed from F&O ban: Nil


0 Comment