30 Dec , 2024 By : Debdeep Gupta

Seasonality analysis in the stock market refers to the study of recurring trends or patterns in stock prices that appear at specific times of the year. It is a tool for traders to make informed decisions about when to buy and sell stocks, sectors, or indices.
What is Seasonality Analysis?
Seasonality in the stock market refers to the tendency for certain stocks or sectors to perform better or worse during particular times of the year. This behaviour can be attributed to factors such as economic cycles, earnings reports, government policy (budget) and investor psychology.
The Importance of Seasonality in Stock Market Analysis:
>> Predicting Market Movements: By analysing seasonal trends, traders can predict when a stock or sector might be more likely to outperform or underperform.
>> Improved Risk Management: Understanding seasonality helps traders time their entries and exits more effectively, minimising exposure during low-performing months.
>> Enhancing Portfolio Returns: Traders can align their portfolios with seasonal trends to optimise returns, increasing the chances of higher profits in certain months.
Seasonality Analysis in Practice: The Nifty50 and Sectorial Indices in January
Let us analyse how seasonality affects the Indian stock market by examining the January performance of Nifty50 stocks and sectorial indices.
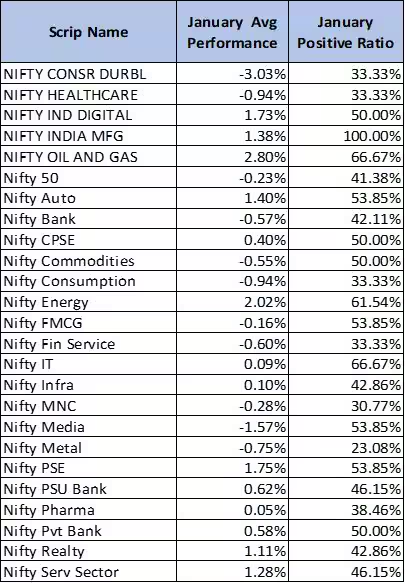
Performance of the Sectoral Index:

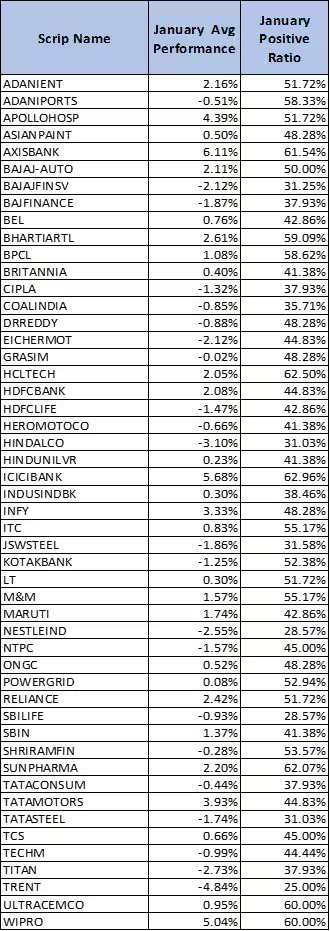
Performance of Nifty50 Stocks
The Nifty50 index comprises 50 large-cap stocks, and their collective performance during January often indicates broader market trends in India.

*Kindly note that the data presented is from 1996 or the date of listing the stocks and sectors.
Here are some common trends observed in January:
>> Month Average Performance metric is a crucial component of seasonality analysis. It tracks the average return of a stock or sector. The idea behind this is to identify if there’s a consistent trend of performance during that month.
>> Month Positive Ratio is another important metric in seasonality analysis. It refers to the percentage of years that a particular stock or sector has had a positive return during a specific month. A high positive ratio indicates that the asset has historically tended to rise in that month, while a low ratio suggests the opposite.
How to Trade with Seasonality Analysis
Traders can use seasonality analysis in several ways to build and enhance their trading strategies. Here are a few strategies:
1> Identifying Seasonal Trends: Traders can buy stocks or sectors that have historically performed well in January. For instance, if historical data shows that Wipro has an average return of 5.04% in January, a trader might look for potential long positions at the start of the month.
2> Positioning Before Seasonal Catalysts: Seasonality is not just about past performance—it’s about anticipating future trends. If January historically shows positive performance due to fresh inflows or favourable economic conditions, traders might enter positions before the expected seasonal catalyst.
3> Leveraging Sectoral Seasonality: Sectors like Oil & Gas performed better in January as the monthly average performance is 2.8%. Traders can rotate their investments into these sectors based on their historical seasonal performance.
4> Using the Positive Ratio for Confirmation: A high monthly positive ratio (e.g., 80%) can be used to confirm an entry point, signalling a higher probability of success. As highlighted, the Oil & Gas index has a 2.8% average gain, but the positive ratio is 66%, indicating that higher chance of success. Traders might initiate long positions if the positive ratio supports their seasonal thesis.
5> Risk Management: Even if the historical data shows positive performance, risk management should still be a priority. Traders can use stop-loss orders to protect against unforeseen downturns and can also use historical performance data to decide on position sizing.
Are you ready?
Seasonality analysis is a powerful tool that helps traders and investors identify recurring patterns in stock, sector, and index performances. Market participants can align their trades with favourable seasonal trends by focusing on metrics like Month Average Performance and Month Positive Ratio.
In the Indian stock market, especially with the Nifty50 and sectorial indices, seasonality can provide insights into potential opportunities in January and other months. Seasonality is not a guarantee, but when used in conjunction with other forms of analysis, it can provide a robust framework for market decisions.
0 Comment